

Remote Monitoring System for Cranes: Key Data & Setup
With the widespread adoption of the Industrial Internet of Things (IoT), digital management of lifting equipment has become a standard requirement in modern factory buildings. Establishing a comprehensive remote monitoring system for cranes typically involves collecting twelve core operational data points, including Lifting Capacity, Travel Speed, and motor current. This capability not only allows managers to monitor equipment status in real-time but also reduces unexpected failure rates by approximately 30% through advanced data analysis. This article provides a detailed breakdown of the system implementation process and explores the essential key technical indicators required for upgrading and retrofitting Smart Cranes.
When designing the system architecture, strict adherence to national and industry specifications is mandatory. For instance, sensor selection and installation positions must align with the load and stress calculation requirements outlined in FEM 1.001 Crane Design Standard. Furthermore, data acquisition sampling frequency and alarm threshold settings must comply with the specific provisions for safety protection devices defined in TSG 51-2023 Crane Safety Technical Supervision Regulation.
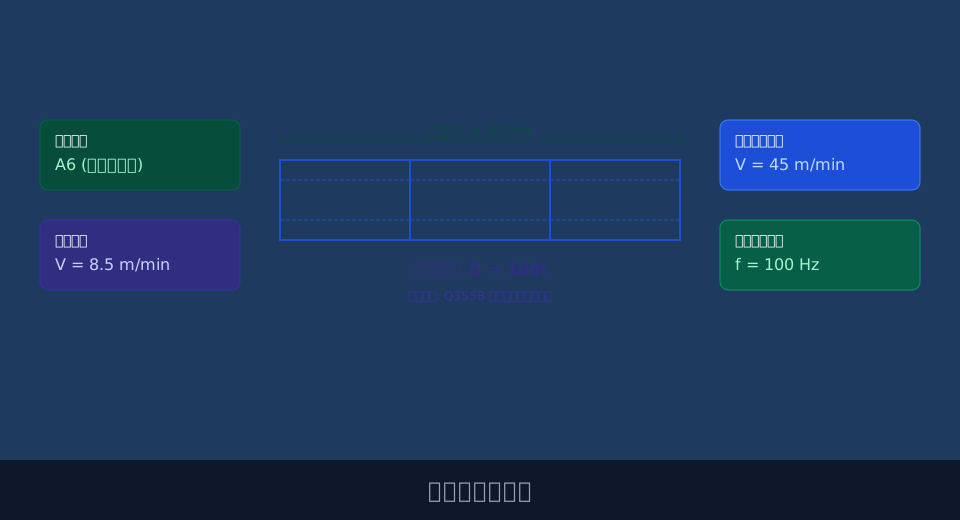
The following sections analyze the implementation details and key technical indicators of crane remote monitoring systems across five dimensions: underlying hardware architecture, core data acquisition, software platform configuration, Predictive Maintenance, and on-site commissioning.
Underlying Hardware Architecture and Sensor Layout for Remote Monitoring Systems
The hardware architecture serves as the physical foundation of the monitoring system, determining the stability and accuracy of data acquisition. In complex industrial environments, sensors must withstand mechanical vibration while resisting challenges such as dust and high temperatures. As an industry leader, Kelude Heavy Industry prioritizes high Protection Rating (IP) grades and redundant design in hardware selection to ensure the reliability of the underlying data source.
Regarding sensor layout, the Load Limiter is typically installed at the fixed end of the wire rope or on the pulley shaft, requiring measurement accuracy within 0.5% to meet precise load monitoring needs. The travel speed Encoder is mounted on the driving wheel axle of the Crane Bridge or Trolley, with a sampling frequency set at 100Hz to capture speed variations during start-up and stop sequences. Additionally, all sensors exposed to workshop environments must have an IP rating of no less than IP65 to prevent signal drift caused by moisture and metal dust ingress.
"According to industry field data, sensors with IP65 or higher protection ratings achieve a Mean Time Between Failures (MTBF) of over 8,000 hours in heavy-dust workshops, representing a ~40% improvement compared to standard IP54 equipment."
For the Anti-Collision System, sensor placement should be based on calculations of the anti-collision safety distance. Laser Distance Sensors should be strategically positioned at rail ends and adjacent crane end carriages to ensure complete signal coverage without blind spots.
⚠️ Note
When installing Load Cells, ensure that load-bearing components are in a natural stress state. Calibration must never be performed when the equipment is suspended or subjected to external pulling forces, as this will cause systematic deviations in Lifting Capacity data.
The core of a Smart Crane lies in its precise perception of operating status. Scientifically defining data acquisition indicators is critical to achieving this goal. Different operational parameters have varying requirements for sampling frequency and accuracy, necessitating categorized configuration.
Core Data Acquisition Indicators and Communication Protocols for Smart Cranes
Once hardware layout is established, it is essential to define which operational data must be collected. Lifting Capacity, Lifting Height, and the positions of Long Travel and Cross Travel constitute basic positional data, with errors controlled within ±1%. Motor current, voltage, and power are core electrical parameters reflecting equipment health. Mechanical status data, such as Brake wear amount and Gearbox oil temperature, are equally indispensable; temperature acquisition ranges typically cover -20°C to 85°C.
Using travel speed data collection and braking performance evaluation as an example, we can verify data validity through specific calculations. Assuming a Long Travel Speed of 60 m/min (equivalent to 1 m/s), and setting deceleration to 0.5 m/s² upon triggering emergency braking, the braking distance $s$ is calculated as $v^2/(2a) = 1^2/(2 \times 0.5) = 1$ meter. The monitoring system must record this process at a sufficiently high frequency to accurately assess the actual performance of the brake.
"With the introduction of AI anti-sway algorithms, the system's accuracy requirements for collecting Trolley acceleration and acceleration time have significantly increased, typically requiring millisecond-level resolution to ensure the control model can correct the Lifting spreader's swing trajectory in real-time."
💡 Tip
For Variable Frequency Drive (VFD) systems, current data acquisition points should be located at the VFD output side rather than the grid input side. This ensures the data truly reflects the actual load on the motor under different frequencies.
The massive amount of collected data must be transmitted to the central server via a reliable communication network. Protocol selection directly impacts the real-time performance and stability of data transmission. The following section provides a detailed comparison of common sensor types and communication protocols.
The table below details the types, monitored objects, and key technical parameters of commonly used sensors in crane monitoring systems, serving as a reference for hardware selection.
📊 Sensor Types and Parameter Comparison
| SensorType | MonitoringObject | Measuring RangeRange | Output Signal | Protection Rating (IP) |
|---|---|---|---|---|
| Pillar TypeLoad Cell / Weighing Sensor | Lifting Capacity | 0~200t | 4-20mA / RS485 | IP67 |
| Absolute encoder | Lifting Height/Operating Position | 0~4096Turn / Rotation | SSI (Synchronous Serial Interface) / Profibus | IP65 |
| Hall Effectcurrent sensor | motor current | 0~1000A | 0-5V / 4-20mA | IP54 |
| PT100Temperature Sensor | Gearbox / Reducer/Braketemperature | -50℃~200℃ | ResistanceSignal | IP65 |
The table below compares the transmission speed, anti-interference capability, and Application Scenarios of several communication protocol commonly used in industrial settings, aiding engineers in network architecture design.
📊 Comparison of Industrial Communication Protocol Features and Use Cases
| ProtocolName | Transmission Rate | anti-interference capability | Application Scenarios | Wiringcost |
|---|---|---|---|---|
| Profinet | 100Mbps | Strong(Requiredshielded twisted pair cable) | Large-scaleWorkshopReal-time Levelcontrol system | Relatively High |
| Modbus TCP | 10/100Mbps | Medium | Data Reporting and StatusMonitoring | Medium |
| CANopen | 1Mbps | Very Strong | Mobile Devices and On-board Networks | Relatively Low |
| MQTT (Based on4G/5G) | Dynamicbandwidth | Dependent on Carrier Network | Cross-regional Remote CloudMonitoring | Very Low(Wire-free) |
"When configuring a data dashboard, Kelude's technical team typically recommends keeping the transmission latency of core safety data under 50ms. The system must also support at least 5,000 concurrent connections to meet the needs of centralized management across multiple workshops."
⚠️ Note
For historical operational data storage, it is recommended to establish a reasonable lifecycle management strategy. Routine status data can be retained for 365 days, while transient high-frequency data triggered by alarms should be preserved permanently to facilitate in-depth fault tracing.
As data accumulates to a significant scale, unlocking its potential value becomes the core focus of system upgrades. Shifting from reactive maintenance to proactive prevention is an inevitable trend in the development of Smart Cranes.
Software Module Development and Data Visualization Configuration for Remote Monitoring Platforms
The software platform serves as the "brain" of the monitoring system, responsible for data processing, storage, and display. An excellent monitoring platform should include core modules such as equipment ledger management, real-time status monitoring, historical trend querying, alarm push notifications, and statistical analysis. In terms of visualization configuration, 3D Digital Twin technology can map the crane's real-time position, posture, and workshop environment, providing managers with an intuitive, comprehensive overview.
Data visualization goes beyond simple charts; it requires hierarchical structuring based on business logic. Level-1 interfaces display the Overall Equipment Effectiveness (OEE) for the entire plant and total alarm counts. Level-2 interfaces focus on real-time operating parameters and health scores for individual cranes. Level-3 interfaces drill down into vibration spectra and temperature curves for specific components. This progressive design enables managers at all levels to quickly locate issues.
"After deploying a visual monitoring platform, a large steel structure enterprise reported a 35% efficiency improvement in routine inspection personnel, as the system automatically generates daily inspection routes and key check items, eliminating the blindness of manual troubleshooting."
💡 Tip
When configuring alarm push notification rules, introduce an "alarm suppression" mechanism. For brief current surges during startup or instantaneous threshold breaches caused by fine-tuning positions, the system should set a 3–5 second delay confirmation to reduce interference from false alarms to management staff.
Based on deep analysis of multi-dimensional operational data, we can establish equipment health models to achieve Predictive Maintenance, addressing faults before they escalate.
Predictive Maintenance and Fault Diagnosis for Cranes Based on Multi-Dimensional Operational Data
The core of Predictive Maintenance lies in predicting the remaining useful life of components through data trends. For example, by continuously collecting vibration data from the Hoisting mechanism, if the vibration amplitude gradually rises from a normal 0.2mm/s to 0.5mm/s, the system can determine that early bearing wear may be occurring. Combined with strain data from weld crack detection, the system can comprehensively assess the fatigue level of the metal structure.
In terms of Fault Diagnosis, leveraging Kelude Heavy Industry's engineering experience in heavy-load applications, we have established an inference engine based on expert rules. When the Gearbox temperature exceeds 75°C accompanied by abnormal noise at specific frequencies, the system automatically matches the fault tree to provide diagnostic recommendations such as "degraded lubricating oil" or "poor gear meshing," and generates spare parts procurement and downtime maintenance plans 14 days in advance.
"After implementing Predictive Maintenance, unplanned downtime for Gantry Cranes at a shipyard decreased by 45%, and spare parts inventory costs were reduced by 20%, fully demonstrating the economic value of data-driven maintenance strategies."
⚠️ Note
Threshold settings for Predictive Maintenance models cannot remain static. As equipment ages or operating conditions change, the model should be retrained and calibrated periodically (e.g., every six months) using the latest operational data to prevent an increase in the false alarm rate.
The final step in system deployment is on-site commissioning and data verification, which is the critical checkpoint for ensuring the authenticity of monitoring data and long-term stable operation.
On-Site Commissioning Process and Data Verification Methods for Crane Remote Monitoring Systems
On-site commissioning is divided into two stages: single-machine debugging and online joint debugging. Single-machine debugging primarily verifies whether sensor signals are correctly connected to the PLC or gateway and checks displayed values on the local HMI. Online joint debugging focuses on testing the integrity and real-time performance of data upload to the Cloud Platform. During the commissioning process, Standard Weights or high-precision multimeters must be used for comparative verification at key measurement points.
Data verification is the core link of commissioning. For Lifting Capacity data, calibration must be performed under three operating conditions: no-load, half-load (e.g., 50t), and full load (e.g., 100t), ensuring the error rate across the entire measuring range is less than 0.1%. For electrical parameters, readings from the monitoring platform must be compared with those from smart meters on-site under the rated voltage of 380V. Additionally, the periodic calibration cycle for the system should be set to 90 days to eliminate cumulative errors caused by zero drift in sensors.
"A rigorous on-site commissioning and verification process is the cornerstone of ensuring long-term stable operation of the monitoring system. Data shows that systems undergoing standardized commissioning can reduce their first-year data anomaly rate to below 2%."
💡 Tip
When conducting full-load or overload tests to verify the Lifting Capacity Limiter, ensure that safety perimeter barriers are fully established and all non-essential personnel have evacuated to safe zones. Strictly prohibit any violation of operating rules during the commissioning process.
In summary, deploying a remote monitoring system for cranes is a systematic engineering project encompassing hardware selection, data acquisition, software development, and on-site commissioning. By scientifically configuring sensors, selecting appropriate communication protocols, and deeply mining data value, enterprises can significantly enhance equipment safety and operational efficiency. Kelude Heavy Industry, with its deep expertise in heavy-load customization, provides end-to-end Smart Crane upgrade services—from conceptual design to implementation—helping clients achieve true Digitalization and intelligent manufacturing.
FAQ
Q: Will data be lost if the monitoring system loses network connectivity?
A: No. Standard remote monitoring systems are equipped with data caching capabilities in both the edge computing gateway and local PLCs. When network interruption occurs, operational data is automatically stored in local memory. Upon network restoration, the system supports breakpoint resume transmission, ensuring complete historical data upload to the server without missing data.
Q: What accuracy grade of current sensor is required for motor current data acquisition?
A: For standard load monitoring and Overload Protection, Hall effect current sensors with an accuracy class of Grade 1.0 or 1.5 are sufficient to meet the requirements. However, for motor efficiency analysis or fine-grained energy consumption management, it is recommended to use sensors with Grade 0.5 or even Grade 0.2 accuracy to capture subtle current fluctuation characteristics.
Q: What is the approximate budget for setting up a complete remote monitoring system?
A: The cost varies depending on the number of devices, functional requirements, and degree of customization. A single basic unit (including only data acquisition and local display) costs approximately $1,500–$3,000. If cloud platform licensing, 3D visualization, and Predictive Maintenance algorithms are included, the per-unit cost increases accordingly. Specific Quotation requires calculation based on the actual project list and is subject to the actual contract.
Q: How long is the construction period for retrofitting an existing crane with a monitoring system?
A: For a single overhead type crane with a relatively simple structure, on-site Sensor installation, wiring, and preliminary commissioning typically require 2 to 3 working days. If the project involves networking multiple devices or retrofitting the existing Electrical Control System, the construction period may extend to about one week. The specific schedule depends on a comprehensive assessment of on-site downtime windows and construction complexity.
