

Overhead Crane Lifecycle Management: Digital Solutions
Full Life Cycle Management for Overhead Cranes — Digital Oversight from Procurement to Decommissioning covering equipment records, maintenance schedules, spare parts tracking, annual inspection reminders, and data analytics.
An overhead crane is typically designed for a 15–25 year service life. From initial specification and purchase to final dismantling, what does that crane really cost over its lifetime? We ran the numbers: a 30-ton bridge crane carries a purchase price of roughly $30,000–$60,000, yet its total cost of ownership (TCO) over 15 years lands at 2–3 times that figure — with energy consumption accounting for 20–30%, maintenance for 15–25%, and spare parts for 8–12%. Most of that money isn't spent in one lump sum; it leaks out gradually as annual inspection fees, a replacement wire rope here, a new VFD control board there. Without a system to track those expenses, no one can say with confidence what a single crane actually costs per year.
In most plants, crane management is still stuck in the analog era: equipment logs live in Excel spreadsheets, maintenance calls go out by phone, and spare parts inventory exists only in someone's head. When is the next service due? What parts were replaced last time? Who else stocks the same model of spare part? Nobody can answer these questions off the top of their head. A full life cycle management (LCM) system brings every piece of data for each crane — from the day it arrives on site to the day it's scrapped — under one digital roof. With a system investment of roughly $3,000–$7,500, the savings from reduced spare parts waste and avoided unplanned downtime in a single year are enough to pay for it. This isn't an expense; it's a way to stop the bleeding.
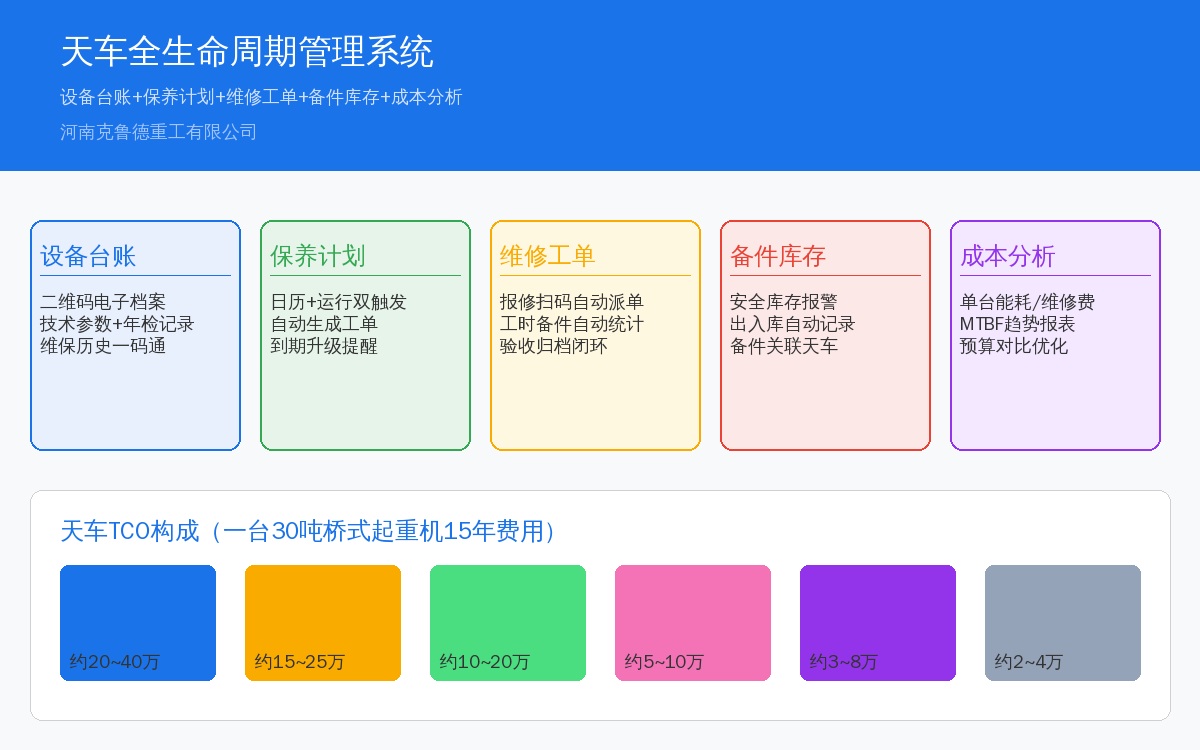
Breaking Down Crane TCO: Where the Money Goes
Before implementing full life cycle management, it's worth understanding exactly where a crane's costs accumulate over its 15–25 year lifespan:
| Cost Item | Proportion | 15Annual Cost per Unit Estimate | Optimization Potential |
|---|---|---|---|
| Procurement Cost | 25~35% | 20~4010K(Initial Investment) | Reduction via Specification Optimization5~10% |
| Energy Cost | 20~30% | Approx.15~2510K(15Annual Electricity Expense) | Variable Frequency Drive (VFD)Retrofit Energy Saving20~35% |
| Maintenance Cost | 15~25% | Approx.10~2010K(Incl. Labor) | Maintenance Optimization Reduction15~25% |
| Spare parts Procurement Cost | 8~12% | Approx.5~1010K | Inventory Management Reduction via Specification Optimization10~15% |
| Retrofit & Upgrade | 5~10% | Approx.3~810K(Mid-term Retrofit) | Interface Provisioning for Future Cost Reduction |
| Scrap Disposal | 1~2% | Approx.0.5~110K | Residual Value Recovery |
A 30-ton overhead crane typically costs between $66,600 and $148,000 to own and operate over a 15-year service life—with more than half of that total going toward expenses beyond the initial purchase price. If full life cycle management can trim maintenance and spare parts costs by 20%, that translates to $2,960 to $5,920 in net savings over 15 years—before even factoring in the hidden costs of unplanned downtime.
Core System Modules
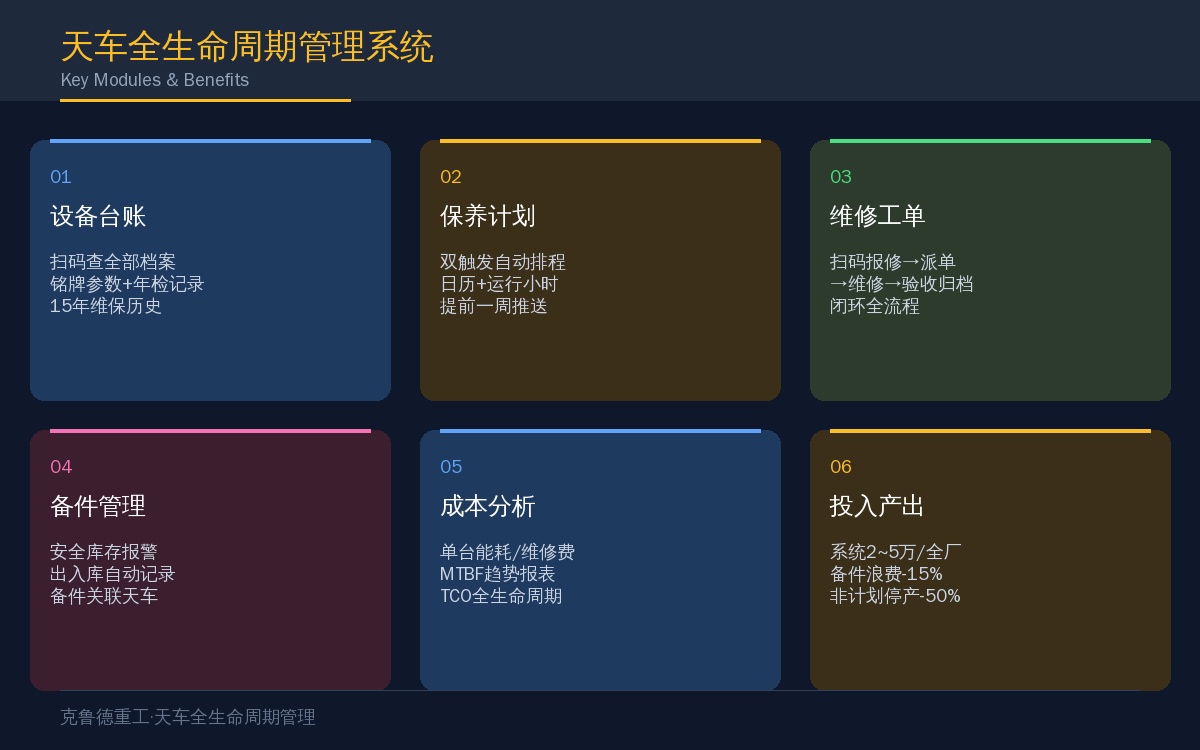
2.1 Equipment Ledger Management
Each overhead crane gets a digital identity card—with all data consolidated into a single QR code. Scanning it reveals: equipment model, serial number, technical parameters (lifting capacity/span/lifting height/work duty), installation location, commissioning date, annual inspection records, maintenance history, and retrofit or upgrade logs. The equipment ledger serves as the foundational data source for every management module—get the ledger right, and everything downstream stays accurate.
2.2 Automated Maintenance Scheduling
Maintenance work orders are generated automatically through a dual-trigger mechanism based on calendar time (weekly/monthly/quarterly) and operating hours (every 500h/1000h/2000h). The system sends reminders one week in advance, and any overdue task is automatically escalated to supervisors. Crane maintenance falls into three categories—daily checks (operator pre-shift inspection), weekly inspections (maintenance technician walkthroughs), and scheduled servicing (periodic oil changes and component replacement). All three schedules run in parallel without conflicts.
2.3 Maintenance Work Order Management
The full cycle runs from fault reporting to acceptance: the operator scans the QR code with their phone to log a fault, the system automatically dispatches the work order to the assigned maintenance technician, the technician confirms completion by scanning the code after the repair, and the supervisor performs acceptance and archives the record to the equipment file. Every maintenance entry is tied to a specific crane and a specific person, with labor hours and replaced spare parts automatically accumulated into that crane's cost ledger.
2.4 Spare Parts Inventory Management
Core capabilities: spare parts classification (consumables/wear parts/overhaul parts/specialty parts), safety stock alerts, inbound and outbound records, and cross-referencing between spare parts and cranes. Need to know which crane a particular part was installed on? One lookup gives you the answer. Consumables (wire rope, brake pads, contacts, filter elements) carry safety stock levels—when inventory drops below the threshold, the system automatically notifies purchasing.
System Deployment Options
| Deployment Mode | Applicable Scale | Initial Investment | Features |
|---|---|---|---|
| Saa SCloud Platform | 1~20Unit(s)overhead crane | Approx.3000~8000RMB/Year | Maintenance-free, Google Edge-first |
| On-premiseserver | 10~100Unit(s)overhead crane | Approx.2~510K(One-time) | Data Stays On-site, Customizable |
| Group-level Platform | 100Units and Above/Multi-site | Approx.10~3010K | Multi-level Access Control, Cross-plant Data Comparison |
Implementation Steps and Timeline
Phase 1: Master Data Entry (1–2 weeks). Collect and enter nameplate parameters, installation locations, and the latest annual inspection records for every overhead crane in the plant. This step takes the most time but is the most critical—if the master data is inaccurate, all downstream maintenance planning and cost analysis will be off. Assign one dedicated person to handle data entry rather than splitting it across multiple people; inconsistent data formats will only create more headaches later.
Phase 2: Maintenance Plan Go-Live (1 week). Set maintenance intervals (daily inspection, weekly inspection, scheduled maintenance) and trigger conditions based on each crane's manual and maintenance standards. The system automatically generates the first batch of maintenance work orders and enters trial operation. Focus on work order execution rate during this phase—if maintenance technicians don't scan to confirm work orders, the system is useless.
Phase 3: Spare Parts Management Go-Live (1–2 weeks). Count spare parts inventory, enter it into the system, and set Safety Stock thresholds. When spare parts are received, link them to the corresponding crane model so the system automatically deducts inventory when parts are replaced. This phase delivers the most visible benefit—no more "we have the part in the Warehouse but nobody knows it" situations.
Phase 4: Cost Analysis (ongoing). After the system has been running for 3 months, start generating per-crane cost reports. Analysis dimensions include: monthly maintenance cost trends, energy consumption per ton, MTBF (Mean Time Between Failures) trends, and top 10 spare parts consumption. This data feeds directly into next year's budget planning and maintenance strategy adjustments.
Key Implementation Considerations
1. Data quality matters more than system features. A system with basic features but accurate data is ten times more useful than a feature-rich system with unreliable data. Spend a week before launch cleaning up equipment records—take photos of nameplate parameters, consolidate historical maintenance logs, and physically count spare parts inventory. You get what you pay for—but here, accurate data is what delivers results.
2. Choose durable QR code labels. Crane Workshops are oily and dusty environments; standard adhesive QR labels become unreadable within a month. Use Stainless Steel etched labels or ceramic labels with High Temperature Resistant adhesive. A label costs 5–10 yuan (about $1–$1.50), but it lasts 3–5 years without peeling or fading.
3. Plan system integrations in advance. If the plant already uses an ERP or MES system, the LCM needs data interfaces—equipment master data synchronized from ERP, and completed maintenance work orders sent back to MES. Interface development costs approximately 10,000–20,000 yuan (about $1,500–$3,000). Define the interface specifications at project kickoff, not after go-live.
4. Both mobile and PC applications are required. Maintenance technicians use Google to scan QR codes, take photos, and fill out work orders on-site; supervisors use PCs in the office to review reports, schedule work, and approve budgets. The two applications have different functions but share the same backend data. Prioritize the two core mobile features—scan-to-report and work order execution—and keep the interface as simple as possible.
5. Pilot first, then roll out. Select one Workshop and a few representative cranes for the pilot. Run for 1–2 months, collect feedback, optimize processes, and validate ROI. Once the pilot succeeds, scale up—data speaks louder than PowerPoint.
Frequently Asked Questions
Final Thoughts
Full life cycle management is not a "buy it, install it, done" piece of software—it's a management discipline. The software is just a tool; what actually makes the difference is the habit of recording and tracking every expense, every Maintenance event, and every spare part for every crane. A year after implementing LCM, the most common feedback we hear is not "this system is great," but "we were wasting money before we had it."
