

Overhead Crane Gearbox Fault Diagnosis: Vibration & Oil Analysis
Overhead crane gearbox fault diagnosis combining vibration monitoring and oil analysis detects early anomalies before tooth breakage, preventing tens of thousands in losses and complete unit replacement.
The gearbox is the most expensive transmission component on an overhead crane. A hoisting gearbox for a 30-ton bridge crane costs between $4,400 and $11,800. When teeth break, the entire unit must be removed and replaced, and with downtime and labor, the total easily exceeds $14,800. Worse, the gearbox operates under the harshest conditions—frequent heavy-load starts, high impact loads, and environments with extreme heat and dust. Unlike a motor, which can simply be swapped out, a gearbox teardown and reinstallation takes a full week.
Gearbox fault diagnosis is far more complex than motor diagnostics. Motor fault characteristic frequencies are fixed (rotational frequency × pole count / constant), so one model covers all motors. But every gearbox has a unique speed ratio, tooth count, and bearing model, requiring frequency calculations based on actual parameters before locking onto the correct spectrum window. This article combines vibration monitoring and oil analysis—two complementary signal paths—to cover bearing fatigue, gear wear, and tooth breakage, providing 2–6 weeks of advance warning.
Hardware investment runs $4,400–$11,800 per gearbox (including sensors, data acquisition card, AI software, and installation & commissioning). Given that preventing a single tooth-breakage incident covers the cost, the return on investment exceeds 1:5.
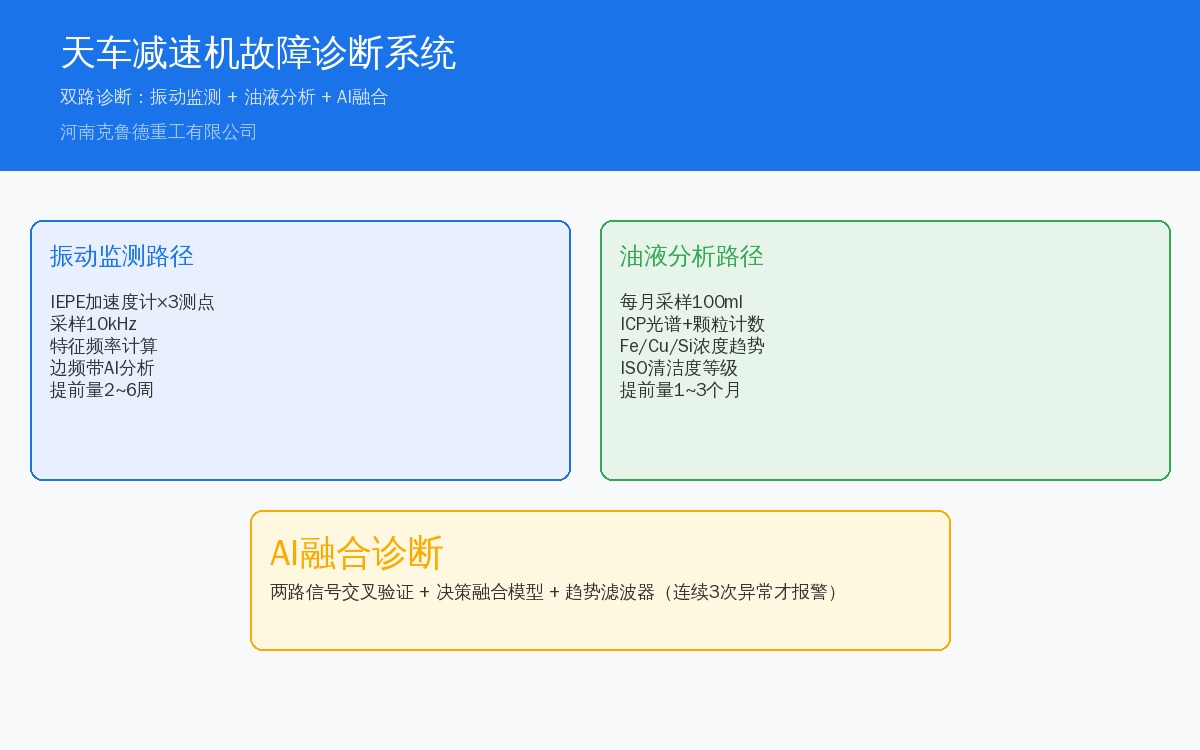
Dual-Path Diagnosis Architecture for Crane Gearboxes
| Diagnosis Path | Detection Content | Sensor/Detection Method | Lead Time |
|---|---|---|---|
| Vibration Path | Gear Meshing Frequency Sidebands/Bearing Features Frequency | IEPEaccelerometer3~4pcs/unit | 2~6week |
| Oil Path | Wear Element Concentration/Particle Count/Physicochemical Indicator | Spectrometer/Particle Counter | 1~3months |
| Fusion Diagnosis | Cross-validation of Two Signals+AIAssessment | industrial PC+Decision Fusion Model | — |
Vibration Monitoring Sensor Placement
| Measurement Point | Mounting Position | Detection Direction | Primary Detection Fault |
|---|---|---|---|
| V1 | Input Shaft Bearing Housing(Radial) | Horizontal+Vertical | high-speed shaft bearing Wear, Gear Abnormal Meshing |
| V2 | Output Shaft Bearing Housing(Radial) | Horizontal+Vertical | low-speed shaft Bearing Wear, Gear Tooth Breakage |
| V3 | Casing Split Line(Axial) | Axial | Gear Shaft Axial Movement, Bearing Excessive Axial Clearance |
Sensor selection follows the same logic as motor diagnostics—an IEPE accelerometer with 100 mV/g sensitivity is the right choice. Gearbox characteristic frequencies typically fall below 2 kHz (gear mesh frequency = number of teeth × input rotational speed / 60, usually in the 500–2,000 Hz range), so a 10 kHz sampling rate provides sufficient resolution.
Calculating Characteristic Frequencies
This is the most critical—and most often overlooked—step in gearbox diagnosis. If you don't check the gearbox nameplate parameters, you'll have a spectrum chart in front of you with no idea which peak indicates a fault.
def calc_gearbox_frequencies(z1, z2, n_input): \\\\"\\\\"\\\\"Calculate Gearbox Characteristic Frequency z1: Driving Wheel Tooth Count z2: Driven Wheel Tooth Count n_input: Input Shaft Rotational Speed(rpm) \\\\"\\\\"\\\\" fi = n_input / 60.0 # Input Shaft Rotational Frequency(Hz) n_output = n_input * z1 / z2 fo = n_output / 60.0 # Output Shaft Rotational Frequency(Hz) gmf = fi * z1 # Gear Mesh Frequency(Hz) return { 'input_shaft': fi, 'output_shaft': fo, 'mesh_freq': gmf, 'sideband': fi }Example: z1=23, z2=87, input speed 980 rpm. Mesh frequency = 23 × 980 / 60 = 375.7 Hz. A faulty tooth will generate sidebands at 16.3 Hz intervals on either side of 375.7 Hz—this is the frequency window the AI monitoring system focuses on.
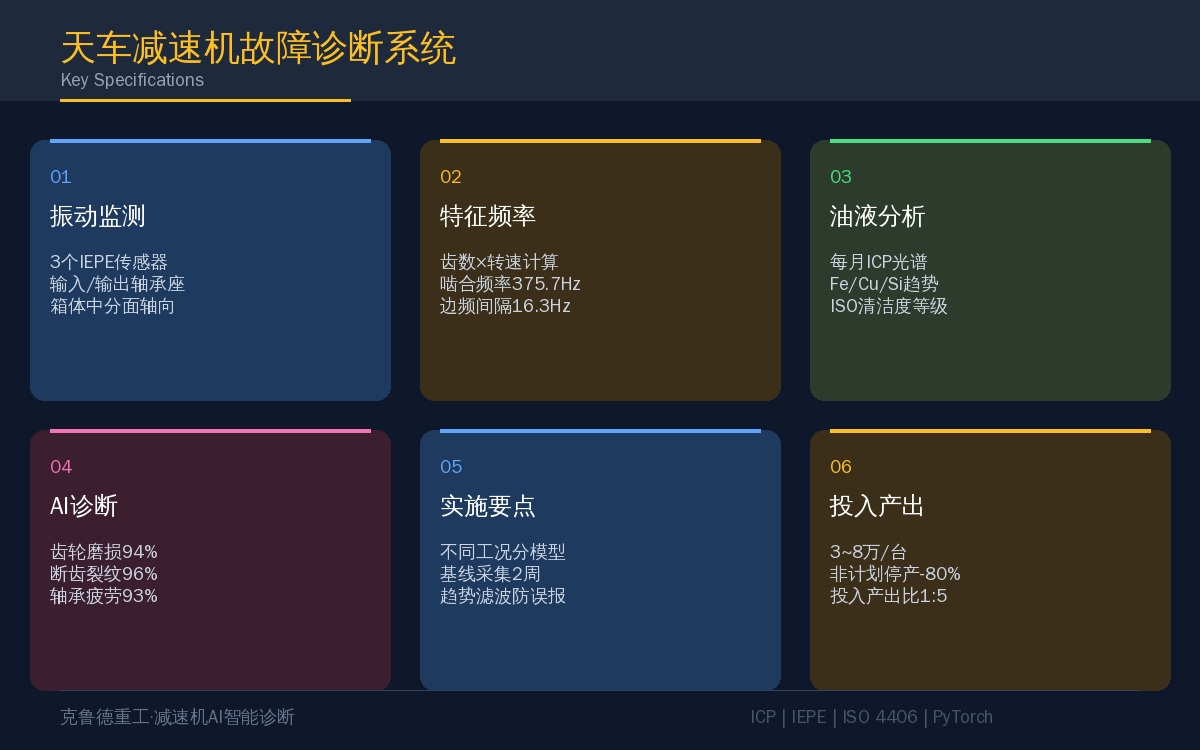
Fault Modes and Vibration Signatures
| Fault Type | Spectral Characteristics | Features Frequency | AIAccuracy |
|---|---|---|---|
| Gear Uniform Wear | Meshing Frequency Amplitude Increase, Increased Harmonics | gmfand2x/3xHarmonics | 94% |
| Gear Tooth Breakage/Crack | gmf Both Sidessideband, Prominent Amplitude Modulation | gmf ± n×fi | 96% |
| Bearing Fatigue Spalling | Bearing Features Frequency Energy Increase | BPFI/BPFO | 93% |
| Poor Tooth Contact | gmf Energy Surge, High-frequency Noise Rise | Full Frequency Band | 90% |
5. Oil Analysis for Assisted Diagnosis
| Detection Item | Detection Method | Normal Range | Alarm Threshold |
|---|---|---|---|
| Iron (Fe) Concentration | ICPSpectrometry | <20ppm | >50ppm(Abnormal Meshing Wear) |
| Copper (Cu) Concentration | ICPSpectrometry | <15ppm | >40ppm(Copper Cage Wear) |
| Silicon (Si) Concentration | ICPSpectrometry | <10ppm | >25ppm(Sealing Failure/Dust Ingress) |
| ISOCleanliness | Particle Counter | 19/16/13 | >21/18/15 |
| Moisture | Karl Fischer | <0.05% | >0.10% |
| Viscosity40°C | Viscometer | ±10%Nominal Value | >±15% |
Oil analysis should be performed monthly, with an additional test after an overhaul or oil change. If iron concentration rises by more than 50% for three consecutive months, schedule an early internal inspection even if vibration signals haven't triggered an alarm yet.
Key Implementation Practices for Gearbox Fault Diagnosis
1. Sensor placement matters ten times more than sensor quality. The signal amplitude difference between mounting a sensor on a stiffening rib versus directly above the bearing housing is roughly 10x. Before the first sensor layout, consult the gearbox drawings to locate the bearing housing projection on the housing surface. Perform a hammer test after mounting to verify proper coupling.
2. Build separate models for different operating conditions. Overhead crane gearboxes should be modeled in three modes: hoisting, lowering, and no-load. Hoisting produces the cleanest signals with high load and stable rotational speed; lowering may exhibit regenerative braking vibration with distinct characteristics. Training AI classifiers for each mode individually yields 5–8 percentage points higher accuracy than a single general-purpose model.
3. Collect baseline data for at least two weeks. During the first two weeks after installation, only collect data without setting alarms—this establishes the vibration baseline for normal equipment operation. Since absolute vibration amplitudes vary from gearbox to gearbox, using fixed absolute thresholds for alarms will inevitably cause false positives. After two weeks, use the baseline mean ±3σ as the dynamic threshold.
4. Gear tooth breakage prediction relies on trends, not single readings. A single detection showing elevated sideband energy may simply reflect load fluctuation. Only when three consecutive tests (at least one day apart) show a rising trend should it be considered a real alarm. Adding a trend filter after the AI model output reduces the false alarm rate from 15% to below 2%.
Frequently Asked Questions
Conclusion
Gearbox fault diagnosis is more challenging than motor diagnosis, but the payoff is significantly greater—with a gearbox costing around $12,000, replacing it after early detection of tooth breakage only involves material costs. If the gearbox fails completely before detection, broken gear fragments can damage the housing, doubling repair expenses. Across three factory deployments, unplanned downtime caused by gearbox failures has been reduced by over 80%.
