

Why Data Cleaning Is the First Step for Crane AI Success
📋 Key Summary
The ceiling for crane AI is often not the algorithm but the data feeding it. Sensor jitter injects noise, sampling gaps create missing values, spikes and outliers distort the signal, and mislabeled samples corrupt the supervision signal—these four types of dirty data can throw a model completely off course. Following a troubleshooting mindset, this article explains how to identify each type, how they progressively degrade model performance, why data is inherently dirty, and a four-step closed-loop approach to cleaning it. If the data isn't clean, no model—no matter how powerful—will ever make it into production.
Many teams spend months tuning model parameters only to hit a stubborn accuracy ceiling, only to discover the root cause isn't the model—it's the data. Feed an AI a set of noisy vibration signals, and it learns the sensor's jitter patterns, not the equipment's true condition.
One steel plant's vibration monitoring model went live and immediately started firing false alarms. Engineers tweaked parameters endlessly with no luck. When they finally audited the training data, they found that half the samples were contaminated by mains-frequency interference from poor sensor grounding—the model had been led astray from the start. Nearly every team working on crane AI deployment has hit this kind of wall.
Data cleaning isn't a nice-to-have preprocessing step; it's the first hurdle AI deployment must clear. Here's a breakdown, following the troubleshooting approach.
Four Dirty Data Types in Crane AI Training: Noise, Missing Values, Outliers, and Label Errors
To treat dirty data like a fault, you first need to recognize what the problem looks like. Training data for crane AI comes primarily from vibration, current, temperature, and load sensors, along with manually entered maintenance records and annotated samples.
Noise is the most common type, showing up as random jitter superimposed on the signal. Common sources include poor sensor grounding, electromagnetic interference from variable frequency drives (VFDs), and loose connections in the data acquisition chain. Noise won't crash the model, but it will skew it—teaching it to treat interference as a pattern.
Missing values are the second type. Sampling packet loss, communication dropouts, and unrecorded downtime all create gaps in time-series signals. When a continuous vibration curve is missing a few seconds in the middle, the model sees an incomplete picture of the operating condition.
Outliers are the third type. Single-point spikes, measuring range overflow, and unit conversion errors all produce values far outside the normal range. A single outlier can distort the normalization range, squeezing normal data into an indistinguishable cluster.
Label errors are the fourth and most insidious type. When manual annotation marks normal operation as a fault, or misclassifies the fault type, the supervision signal is wrong—and the harder the model trains, the more confidently it learns the wrong thing. In its data governance practice, Kelude Heavy Industry treats these four dirty data types as fault sources on the data side.
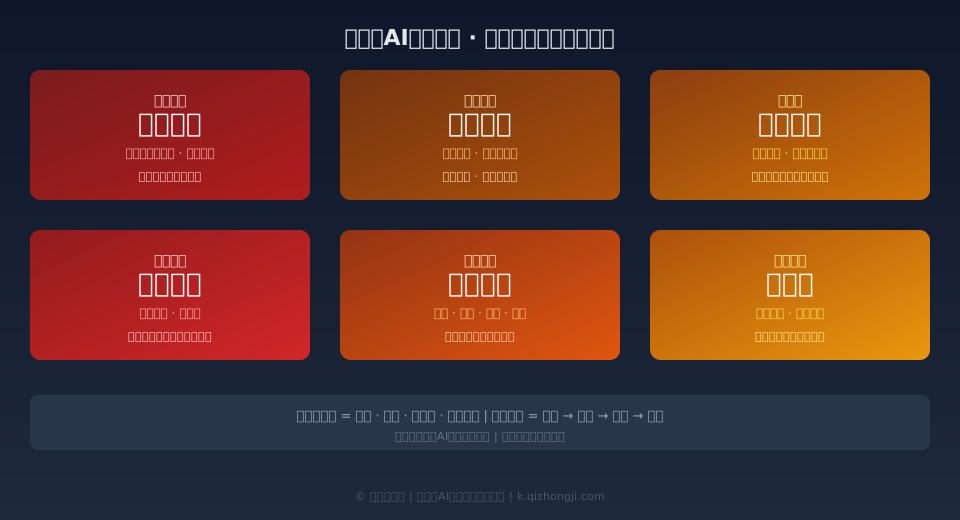
How Dirty Data Destroys a Model: The Chain from Feature Distortion to Overfitting to False Alarms
Dirty data doesn't damage a model all at once—it propagates along a chain, amplifying at each step.
Step one is feature distortion. Noise and outliers cause the model to extract features that deviate from the true operating condition—for example, mistaking mains-frequency interference for a high-frequency vibration signature. Once the features are wrong, everything downstream is wrong.
Step two is overfitting. Label errors and sample imbalance push the model to memorize incorrect patterns in the training set, causing its generalization ability to collapse in real-world conditions. Training accuracy looks great; field performance falls apart.
Step three is false alarms and missed alarms. By the time data deviations reach the model's output, you get alarms that shouldn't fire and real faults that go undetected. Once maintenance crews lose trust in the alarm system due to repeated false alarms, genuinely dangerous warnings get ignored too. This is precisely why ISO 24621, "AI Fault Diagnosis for Cranes," emphasizes the quality of diagnostic data.
Why Data Is Inherently Dirty: Sensor Drift, Manual Entry, and Mixed Operating Conditions
Dirty data isn't anyone's fault—it's a product of several inherent conditions at the equipment site.
The first root cause is sensor drift. Vibration sensors lose sensitivity over extended operation, and temperature sensors are affected by ambient heat sources, shifting both their measuring range and zero point. Hardware-level drift can't be corrected by algorithms alone.
The second root cause is manual entry. Maintenance records rely on human input, and fields like downtime, fault type, and replaced components are routinely left blank, filled in incorrectly, or recorded inconsistently. Manually entered data carries inherent uncertainty.
The third root cause is mixed operating conditions. The same crane runs at full load during the day and light load at night, in summer heat and winter cold. Signals from different operating conditions get mixed into the same batch of data, making it hard for the model to distinguish load variation from fault symptoms. GB/T 28264, "Safety Monitoring and Management System for Lifting Appliances," sets requirements for traceability and record-keeping of monitoring data precisely to backstop data quality.
Managing the sensor source and the data acquisition chain is the fundamental fix. ISO 24445, "Technical Specification for Smart Sensors in Cranes," defines the technical requirements for smart sensors and serves as the benchmark for data source quality.
Data Cleaning in Practice: A Four-Step Closed Loop—Denoise, Impute, Reject, Recalibrate
Data cleaning isn't a one-time action; it's a closed loop that must be embedded in the data pipeline, with four steps.
Step one: denoise. Use filtering and thresholding to remove sensor jitter and mains-frequency interference, preserving the true operating signal.
Step two: impute missing values. Use interpolation for short gaps; discard samples with long gaps rather than forcing a fill.
Step three: reject outliers. Identify anomalous values using physical ranges and statistical distributions, then determine whether they represent faults or acquisition errors based on the operating condition.
Step four: recalibrate labels. Use cross-validation and rule-based review to correct mislabeled samples, bringing the supervision signal back on track.
This loop must run continuously, because data keeps being generated and keeps getting dirty. Kelude Heavy Industry builds cleaning into the data pipeline rather than treating it as a one-time pre-deployment task. The table below summarizes the specific cleaning methods and priorities for each dirty data type.
Dirty Data Diagnosis Reference Table
| Dirty Data Types | Typical Sources | Impact on Model | IdentificationMethods | Cleaning Methods |
|---|---|---|---|---|
| noise | SensorGroundingAdverse、Frequency Inverter / VFDInterference | Feature Distortion、Learned Bias | spectrum analysisExamine Abnormal Frequency Bands | Filtering、thresholdTruncation |
| Missing Data | Sampling Packet Loss、Communication Interruption | Time Series Breakpoints、operating conditionIncomplete | Timestamp Continuityinspection | Short Interpolation、Long Deletion |
| Outliers | Spikes、Measuring RangeOverflow、UnitErrors | Normalization Distortion、Compression of Normal Values | Physical Range vs. Statistical Distribution | Quantile Truncation、operating conditionReview |
| annotationErrors | Manual Mislabeling、Inconsistent Definitions | Supervision Signal Contamination、Overfitting | Cross-validationverification、Rule-based Review | Re-annotation、Confidence Weighting |
| operating conditionAliasing | load、Temperature and Humidity、speedVariation | Faults andoperating conditionDifficult to Distinguish | Segment-wise Analysisoperating conditionPhysical Range vs. Statistical Distribution | Componentoperating conditionModeling、Normalization |
Quick Reference of Standard Clauses on Data Quality
| Standard | Key Clauses | Relationship with Data Cleaning |
|---|---|---|
| GB/T 28264 Safety Monitoring and Management System《lifting appliancesSafety Monitoring and Management System》 | safety monitoringData Traceabilitytraceable | Data Quality Assurance |
| ISO 24621《craneAI fault diagnosis》 | AI fault diagnosisData Quality Framework | DiagnosisData Quality Baseline |
| ISO 24445《cranesmart sensortechnical specification》 | smart sensortechnical specification | sensor dataTypical SourcesSpecification |
| FEM 1.001 Crane Design Standard《crane design specification》 | Load combinationFaults andWork Duty / Classification | operating conditionclassification basis |
📖 Related reading: Crane AI vision algorithm training and testing platform built, with over 500,000 annotated images of industrial defects | Equipment health management (PHM): big data and ML-driven predictive maintenance for overhead cranes
FAQ: Crane AI Data Cleaning
Q: For crane data cleaning, which is more reliable — manual cleaning or rule-based automated cleaning?
A: Each serves a different purpose; it's not an either-or choice. Rule-based automated cleaning is well suited to quantifiable tasks like noise removal and outlier rejection — it's fast and consistent. Manual cleaning fits steps that require business judgment, such as annotation calibration, where it can resolve ambiguities that rules can't capture. At Kelude, rules handle the coarse pass first, then manual review verifies the annotations — the two work together rather than replacing each other.
Q: After deployment, the model keeps producing false alarms. How do I tell whether it's dirty data or a model problem?
A: Start by auditing the quality of both the training data and the production data. Check for four categories of issues — noise, missing values, outliers, and annotation errors — to see whether dirty data has slipped in. Clean the newly collected data and retest: if false alarms drop noticeably, the root cause is in the data. If false alarms persist after cleaning, then look at the model structure and features. The order is data first, model second.
Q: How much time and manpower does a data cleaning pass typically take?
A: It depends on the data volume and how dirty the data is — there's no one-size-fits-all figure; it comes down to the actual operating condition. For a small pilot dataset, you can run a quick rule-based pass and see results within days. For large volumes with frequent annotation errors, cleaning and review should be planned in weeks. Kelude's experience is to build the cleaning pipeline first; it's an ongoing investment rather than a one-time cost.
Data is the foundation of crane AI. If the foundation is weak, even the most sophisticated algorithms won't deliver. Kelude treats data cleaning as the first step in deployment, using a four-step closed loop to keep dirty data out of the model — so the AI learns the true state of the equipment, not the vibration patterns of the sensor.
