

Overhead Crane Smart Gateway: OPC UA Data Acquisition
Smart Gateway & Edge Computing for Overhead Cranes: OPC UA Data Acquisition and Protocol Conversion in Practice. The smart gateway and edge computing system for overhead cranes forms the critical link between the equipment layer and the information layer—handling protocol conversion, data acquisition, edge computing, and store-and-forward buffering between PLCs/VFDs and MES, SCADA, and cloud platforms.
The smart gateway and edge computing system for overhead cranes is the critical bridge between the equipment layer and the information layer—performing protocol conversion, data acquisition, edge computing, and offline data buffering between PLCs/VFDs and MES, SCADA, and cloud platforms. Kelude has built a standardized crane data acquisition and protocol conversion architecture based on the Siemens Industrial Edge Gateway IOT2050 and its proprietary edge data platform. The system supports real-time interconversion across five protocols—PROFINET, OPC UA, Modbus TCP, MQTT, and REST API—with a single gateway capable of collecting operational data from up to 8 overhead cranes simultaneously. Edge processing latency stays below 50 ms, and store-and-forward buffering ensures zero data loss during network interruptions. This article provides a systematic walkthrough of the engineering practice, covering hardware selection, protocol stack configuration, data modeling, and deployment operations.
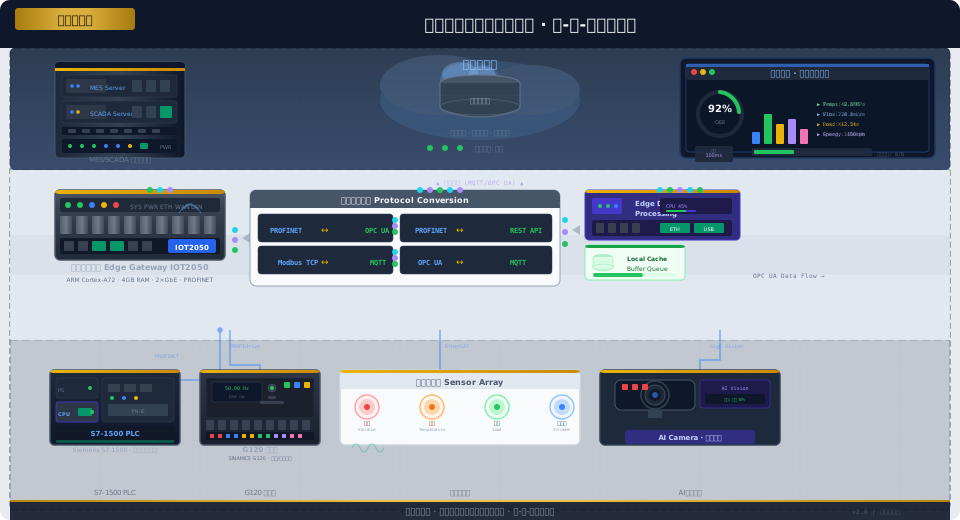
Industrial Edge Gateway Hardware Selection and System Architecture
The core hardware of a crane data acquisition system is the industrial edge gateway, deployed inside the crane control cabinet or at a nearby field control station. It connects upward to the workshop-level network and downward to the crane PLC via a direct PROFINET link. In its standardized solution, Kelude selects the Siemens Industrial Edge Gateway IOT2050 as the primary hardware platform. The gateway is powered by an ARM Cortex-A72 quad-core processor (1.5 GHz) with 4 GB DDR4 RAM, and features dual Gigabit RJ45 Ethernet ports, two USB 3.0 interfaces, and an industrial-grade SD card slot. It runs Siemens Industrial Edge and Linux-container-based Edge Apps. The IOT2050 supports wide-temperature operation from -20°C to 60°C, carries an IP20 Protection Rating, and is designed for DIN-rail mounting inside control cabinets.
| Parameter | Siemens IOT2050 | Domestic Replacement Solution |
|---|---|---|
| processor | ARM Cortex-A72 1.5GHzQuad-Core | RK3568 2.0GHzQuad-Core |
| Memory | 4GB DDR4 | 4GB LPDDR4 |
| Storage | 32GB e MMC + SDSlot | 64GB e MMC + M.2 SSD |
| Ethernet | 2×Gigabit RJ45 | 2×Gigabit RJ45 |
| Protocol Support | PROFINET/OPC UA/Modbus/MQTT | PROFINET/OPC UA/Modbus/MQTT |
| Operating Environment | Industrial Edge / Yocto Linux | Debian / Ubuntu |
| Operating Temperature | -20°C~60°C | -20°C~70°C |
| Mounting Method | DINDIN Rail/Wall Mount | DINDIN Rail/Wall Mount |
The system architecture follows a three-tier edge-cloud deployment model. At the device level, each overhead crane control cabinet houses an S7-1500 PLC, G120 VFDs, encoder interface modules, and a sensor array. The PLC publishes operational data to the gateway over PROFINET IO at a 10 ms cycle, while the G120 drives report motor speed, current, temperature, and fault codes via the PROFINET drive profile. At the edge layer, an IOT2050 gateway runs four core Edge Apps: an OPC UA server (aggregating UA data from all PLC nodes), a protocol conversion engine (PROFINET, OPC UA, Modbus, MQTT), an edge data processing unit (with cache queue, resumable transfer, and data compression), and a data security module (TLS encryption plus access control lists). The cloud tier comprises the MES execution system, SCADA monitoring platform, and a Digital Twin operations dashboard, all communicating with the edge gateway via OPC UA clients or an MQTT broker.
OPC UA Server Configuration and Data Node Modeling
OPC UA is the core communication protocol linking crane PLCs to the upper-level systems. Kelude has designed a standardized crane information model within the edge gateway's OPC UA server, organizing and naming data nodes according to the OPC UA for Machinery companion specification (IEC 62541-100). This ensures consistent data structures across all cranes, eliminating the need for MES and SCADA systems to perform per-crane custom integration.
The information model is structured into four hierarchical levels. The first level is the Site layer, corresponding to a workshop or factory building—the node path "/Site/Workshop_01" contains the collection of all cranes in that facility. The second level is the Area layer, representing crane clusters within the same bay or at the same workstation—the node path "/Area/Bay_A" includes the three cranes operating in that bay. The third level is the Device layer, corresponding to an individual crane—the node path "/Device/Crane_01" contains all grouped data for that specific crane. The fourth level is the Function layer, covering the functional units of the crane control system: the Motion control group (operating mode, target position, actual position, speed, acceleration status), the Drive VFD group (motor current, speed, temperature, operating status, and alarm codes for each mechanism), the Brake group (open/closed status of both brakes, electromagnet current, wear count, and desynchronization flag), the Safety status group (STO/SLS/SBC/SDI states, emergency stop trigger count, safety event log), and the Diagnosis group (system uptime, fault code queue, PLC date/time stamp).
Data nodes follow camelCase naming conventions, with each node containing a data type definition and description. Key nodes include Motion.ActualPosition (Int32, unit: mm), Motion.Speed (Real, unit: m/s), Drive.Current_A (Real, unit: A), Brake.Status_A (Boolean, True = brake open), Brake.UnsyncCount (UInt16), Safety.STO_Active (Boolean), and Safety.EventCount (UInt32). During on-site deployment, all 26 standard OPC UA nodes per crane undergo address mapping and data type validation. After mapping is complete, the UA Expert tool is used to scan and verify the readability and data type correctness of every node.
| Function Group | Node Count | Typical Node | Data Type | Acquisition Frequency |
|---|---|---|---|---|
| Motion Control Motion | 6 | Position/Speed/Mode | Int32, Real, UInt16 | 50ms |
| Frequency Inverter / VFDDrive | 8 | Current/Temp/Status | Real, UInt16, String | 100ms |
| Brake | 5 | Status/Current/Wear | Boolean, Real, UInt32 | 200ms |
| Safety State Safety | 4 | STO/SLS/Event Log | Boolean, UInt32 | 20ms |
| Diagnosis | 3 | Uptime/Fault Queue | UInt32, String[] | 1s |
Protocol Conversion Layer: PROFINET to OPC UA / Modbus / MQTT
Protocol conversion is the core function of the edge gateway. The overhead crane PLC publishes data to the gateway over PROFINET IO in real-time cycles (10 ms). The gateway's protocol conversion engine parses the PROFINET IO data into a unified internal data format, then repackages it according to the target requirements of each downstream protocol. The gateway simultaneously runs three protocol egresses—an OPC UA server, a Modbus TCP server, and an MQTT client—serving the MES system, SCADA system, and Cloud Platform, respectively.
OPC UA egress configuration. The gateway's OPC UA server is built on the open62541 open-source stack and supports both the OPC UA binary protocol (default port 4840) and HTTPS (port 443). The server security policy is set to Basic256Sha256 with signature and encryption (SecurityMode=SignAndEncrypt). Client authentication uses an X.509 certificate whitelist—only OPC UA clients whose certificates are in the gateway's trust list are allowed to connect and read data. The server publishes the 26 standard overhead crane nodes described earlier. UA clients (e.g., the MES system's OPC UA Client) discover the full node structure via Browse operations, then subscribe to batch-read real-time data. The minimum supported subscription sampling interval is 50 ms.
Modbus TCP egress configuration. The gateway maps the standard crane data to a Modbus register table, with register addresses assigned contiguously starting from 40001—40001 to 40006 map to the six registers of the Motion function group, 40007 to 40014 to the eight registers of the Drive function group, 40015 to 40019 to the five registers of the Brake function group, and 40020 to 40023 to the four registers of the Safety function group. Each register occupies 2 bytes; 32-bit data types (e.g., Real, Int32) span two consecutive registers. The SCADA system acts as a Modbus TCP Master (default port 502) and polls register addresses cyclically. A single read request can fetch data from a contiguous address range in one batch, reducing network overhead.
MQTT egress configuration. The gateway's edge data processing unit connects to the Cloud Platform's MQTT Broker (e.g., EMQX or VerneMQ, default port 8883) as an MQTT client, with TLS-encrypted communication. MQTT topics follow a three-level device hierarchy: topic/workshop_id/crane_id/function/parameter, for example, krunde/workshop01/crane_01/motion/position. Data is published with QoS=1 (at-least-once delivery) and the payload is wrapped in JSON, containing three fields: timestamp, value, and quality stamp. The typical MQTT publishing frequency is once per second, with a payload of approximately 200 bytes per crane per publish. With eight cranes running simultaneously, the resulting network traffic is roughly 1.6 KB/s.
Edge Data Processing and Store-and-Forward for Interrupted Connections
Reliable collection of crane operating data depends on the edge gateway's local data buffering and store-and-forward mechanism. Industrial network environments—particularly WiFi roaming caused by cranes moving along the crane rail, or harmonic interference from workshop VFDs—can cause brief interruptions in the connection between the gateway and the Cloud Platform. To address this, Kelude's edge data platform incorporates a ring buffer cache and a resume-on-reconnect mechanism.
The data caching layer uses a two-tier architecture combining memory and SD card storage. The primary cache is an in-memory ring buffer with a capacity of 10,000 data records (at 200 bytes per record, this consumes approximately 2 MB of RAM). Memory cache write latency is under 1 ms. The system operates on a producer-consumer model: the OPC UA, Modbus, and MQTT egress threads act as consumers, reading records from the buffer and forwarding them, marking each record as processed after successful transmission. The secondary cache is an SD card file cache. When a network outage causes data to back up beyond the memory threshold (default 80%), the edge data processing unit automatically spills the backlog to SD card cache files. SD card capacity depends on the card size (a 32 GB industrial-grade card is recommended). At the maximum cache duration of 7 days, approximately 1.2 GB of space is required; a 32 GB SD card can hold more than 180 days of crane operating data.
The store-and-forward strategy covers three interruption scenarios:
- Short interruption (≤30 seconds): The memory cache is sufficient to hold the backlog. When the network recovers, the protocol stack egress threads automatically reconnect their TCP sessions and rapidly transmit the buffered data in timestamp order in a single burst.
- Medium interruption (30 seconds to 2 hours): Once memory overflows, data automatically spills to the SD card file cache. After reconnection, the resume-on-reconnect file synchronization module scans the SD card for unsent cache files and uploads them at a rate of 500 records per second (requiring roughly 212 KB/s of upstream bandwidth, which a 10 Mbps workshop network can readily provide).
- Long interruption (≥2 hours): When the SD card cache reaches capacity (i.e., the number of cache files hits the alarm threshold), the edge platform automatically executes a cache eviction policy—discarding the oldest records on a timestamp FIFO basis—while simultaneously triggering a local alarm on the crane's Operation Panel to notify maintenance personnel. Once the network is restored, the gateway reports the timestamp range of the missing data records to the MES system, which then decides whether to backfill the data from the PLC's historical records.
Data Security and Access Control for Industrial Edge Platforms
Data security for the crane edge data platform follows the ISA/IEC 62443 industrial cybersecurity standard. Security measures are organized into three layers: transport security, access control, and audit logging.
Transport security. TLS 1.3 encryption is enabled on all external communication links. The OPC UA server is configured for Basic256Sha256 signed and encrypted communication, with unencrypted connections disabled (SecurityPolicy=None is prohibited). The MQTT client connects to the MQTT Broker over TLS, with server certificate verification using CA chain validation—the gateway is pre-loaded with the factory CA certificate, and self-signed certificate connections are not permitted. Because the Modbus TCP protocol does not natively support encryption, a VPN tunnel (WireGuard) is established between the edge gateway and the SCADA server to create an encrypted channel through which Modbus packets travel. The VPN tunnel uses pre-shared key (PSK) authentication, with keys rotated every 90 days.
Access control. The edge gateway implements a role-based access control (RBAC) model with three predefined roles, as shown above. Each role is mapped to a set of OPC UA node permissions and MQTT topic read/write rights. The Admin role has full read/write access to all nodes and can modify OPC UA server settings (ports, certificates, security policies). The Operator role can read real-time data and alarm nodes and write to setpoint and acknowledgment nodes. The Viewer role is read-only, intended for maintenance engineers and management dashboards. All role assignments are managed centrally through the Cloud Platform and pushed to the gateway over an encrypted channel.
Audit logging. The gateway records all security-relevant events in a local audit log, including login attempts (successful and failed), configuration changes, certificate updates, and role assignment modifications. Audit logs are stored in a write-once, read-many (WORM) format to prevent tampering and are periodically uploaded to the Cloud Platform for centralized retention. Log entries include a timestamp, user ID, source IP address, event type, and outcome. The audit log retention period is configurable, with a default of 180 days.
OPC UA certificates for the three roles are uploaded and bound via the gateway's web management interface. When a UA Client connects, the gateway validates the Common Name field in the client certificate to determine the role and applies the corresponding permissions. MQTT access control is enforced through ACL rules. Each MQTT Client is authenticated by username and password, and ACL rules define the specific MQTT topics the client can publish to or subscribe to.
The audit log layer records all data access events. Every OPC UA client connection/disconnection, every MQTT Client subscription/unsubscription, and any Modbus TCP read request exceeding 20 requests per second (which triggers connection rate limiting) — all are logged in the gateway's audit log file. The log format includes a timestamp, source IP address, protocol type, operation type, and operation result. Audit logs are automatically rotated and retained for 90 days. Log files are encrypted at rest and can only be downloaded and viewed by the Admin role via the gateway's web management interface.
Deployment, Commissioning & Maintenance
Deploying and commissioning the overhead crane edge gateway follows a standardized procedure. The first step is hardware installation: mount the IOT2050 on a DIN rail inside the control cabinet (occupying 4 standard module widths). Connect the gateway to the workshop PROFINET network switch using a shielded CAT6A cable, and connect it to the office network switch (for MQTT uploads and remote management) via a second cable. Power the gateway with 24V DC from the control cabinet's switching power supply, with an EMC filter (rated current 0.5A) installed at the power input.
The second step is deploying the edge software environment. Use the Siemens Industrial Edge Management (IEM) platform to remotely push Edge App images to the IOT2050. The deployment order is: base runtime environment (Docker and network configuration) → OPC UA Server App → Protocol Conversion Engine App → Edge Data Processing App → Data Security Module App. After each App deployment, a self-check script verifies the container's running status and port listening status. For the domestic solution, push the Docker Compose configuration file and images via SSH, then execute docker-compose up -d for one-command deployment.
The third step is OPC UA communication verification. Use UA Expert to connect to the gateway's OPC UA server (default port 4840), import the CA-signed client certificate, and verify that the Browse function can traverse all 26 standard nodes. Perform a Read operation on each node to confirm the data type and value range are correct. Use UaExpert's Subscription function to subscribe to the Motion.Position node (sampling interval 50ms), observe whether the data refreshes in real-time and remains stable, and verify that the subscription packet loss rate is ≤0.1%.
The fourth step is data reporting verification. In an MQTT test client terminal, subscribe to the topic krunde/workshop01/+/motion/position and observe whether the JSON format of the data published by the gateway is correct. Use Modbus Slave to simulate a SCADA system reading register addresses 40001~40023, and verify that the data values match those displayed on the PLC. Perform a network disconnection test: unplug the gateway's operational network cable for 30 seconds, verify that the SD card cache file is created automatically, and after network recovery, confirm that the store-and-forward module automatically uploads the cached data. Verify on the MES side that there is zero data loss and that timestamps are continuous.
The fifth step is operations management configuration. Configure alarm rules in the gateway's web management interface (HTTPS://192.168.x.x:8443): trigger an email alert on OPC UA client connection timeout (default 30 seconds); trigger an alert on MQTT Broker heartbeat loss (no PINGRESP for 60 seconds); trigger an alert when SD card cache usage exceeds 80%; and trigger an alert when gateway CPU usage continuously exceeds 80% for 5 minutes. All alerts are pushed via SMTP to the operations engineer's email. Additionally, the local operation panel's LED indicator lights provide on-site status indication (green = normal, red = alarm, yellow = maintenance).
