

Overhead Crane SHM System: Strain Monitoring & Fatigue Life
Crane Structure Health Monitoring System (SHM) uses online strain sensors, fiber Bragg gratings, and vibration accelerometers to continuously track the load conditions of the crane's steel structure. A fatigue damage algorithm assesses the remaining life, and an alarm triggers the moment any anomaly is detected. The system leaves the existing electrical system and control logic untouched, with installation completed in just 3–5 days and hardware costs ranging from approximately $7,400 to $14,800 per unit.
Main girder fractures, end carriage cracks, weld seam fatigue—these are not rare events. With over a decade of overhead crane maintenance and retrofit experience, we've learned that hidden structural damage is the biggest safety blind spot: the outside may look perfectly fine while the inside is already cracking. Traditional annual inspections only catch surface issues, and with a full year between checks, cracks can grow silently in the meantime.
Structural Health Monitoring (SHM) addresses exactly this problem. Using online strain sensors, fiber Bragg gratings, and vibration accelerometers, it continuously monitors the load conditions of the crane's steel structure, evaluates remaining life through fatigue damage algorithms, and raises an alarm as soon as an anomaly appears. SHM has been a proven technology in bridge and wind power applications for over a decade, yet its adoption in the overhead crane industry remains surprisingly low—not because the technology is immature, but because many operators simply don't realize cranes can be retrofitted with it, or how much money it can save them.
A typical SHM system costs between $7,400 and $22,200 per crane. Compared to the cost of personnel injuries or production downtime caused by a structural fracture, this investment is easily justified. What's more, after installation, the inspection interval can be extended from 12 months to 18–24 months (per ISO 4301), meaning the savings on inspection fees alone can pay back the system within two to three years.
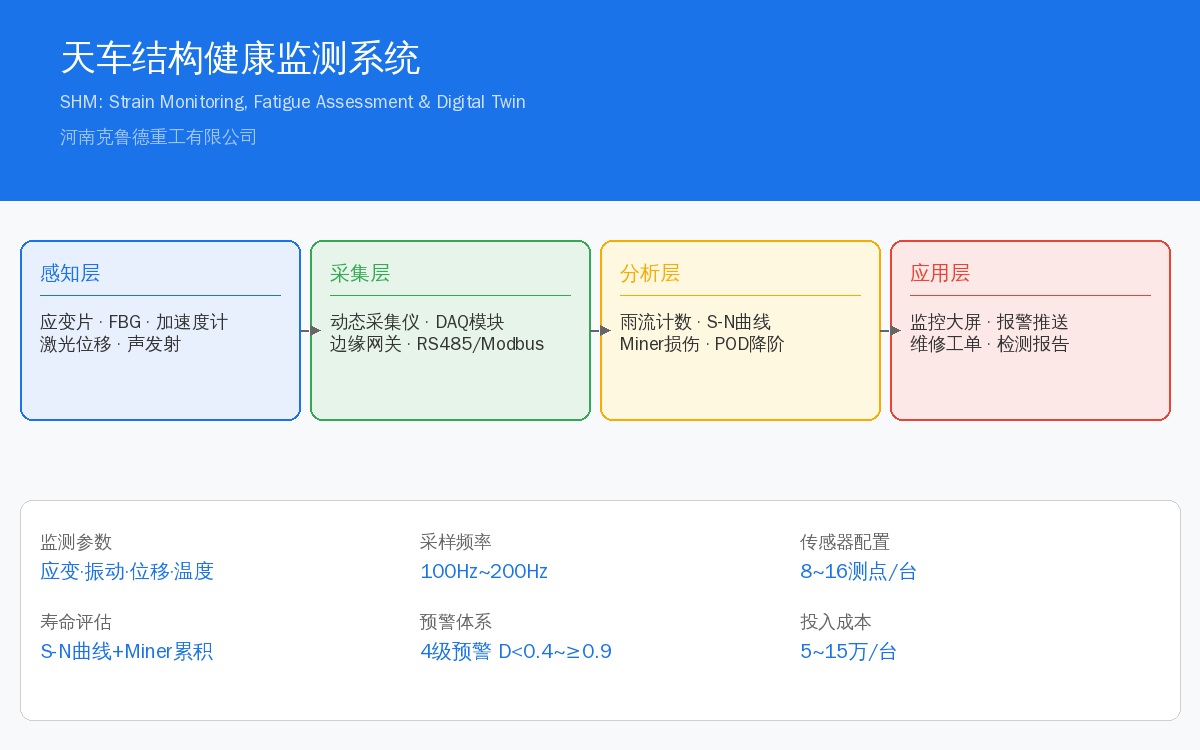
SHM System Architecture: Four Layers from Sensor to Dashboard
The crane SHM system uses a four-layer architecture, with data flowing in one direction—from sensors all the way to the maintenance decision dashboard:
| Level | Function | Core Component | Data Flow |
|---|---|---|---|
| Sensing Layer | Structural Mechanical Response Acquisition | Strain Gauge/Fiber Bragg Grating (FBG)/accelerometer/Displacement Sensor | Sensor Data Acquisition Unit |
| Acquisition Layer | Signal Conditioning+Analog-to-Digital Conversion (ADC) | Dynamic Strain Acquisition Unit/DAQModule/Edge Gateway | Acquisition Edge Node |
| Analysis Layer | Data Processing+Damage Identification+Life Assessment | industrial PC/Edgeserver/SHMAlgorithm Engine | Edge Node Platform |
| Application Layer | Visualization+Alarm+Decision Support | monitoring screen/Mobile Terminal/Maintenance Work Order System | Platform User |
Sensor Selection and Deployment Strategy
Sensors form the foundation of any SHM system—choose the wrong type or install it in the wrong location, and the data you collect is worthless. For overhead crane steel structures, three core parameters require monitoring: stress and strain, vibration response, and structural deformation.
2.1 Strain Monitoring
Strain gauges are the most widely used sensors in overhead crane SHM systems. They are typically installed at critical locations including the mid-span of the main girder, end carriage connections, and weld seam stress concentration zones. Resistance strain gauges offer low cost (20–50 CNY per gauge) and proven technology, but require on-site bonding and waterproofing, with long-term drift of approximately 3–5%. Fiber Bragg Grating (FBG) strain sensors deliver higher accuracy (1με), zero drift, and immunity to electromagnetic interference. A single FBG channel can accommodate up to 20 measurement points in series, making them ideal for long-term monitoring programs—though at a higher unit cost of 800–1,500 CNY per point. Our recommendation: use FBG sensors for critical cross-sections (main girder mid-span) and resistance gauges for secondary measurement points (end carriages, stiffener plates). This hybrid approach delivers the best cost-to-performance ratio.
| Parameter | Resistance Strain Gauge | Fiber Bragg Grating (FBG)(FBG) | Vibrating Wire Strain Gauge |
|---|---|---|---|
| Measuring Range | ±5000με | ±5000με | ±3000με |
| Accuracy | ±5με | ±1με | ±2με |
| Long-term Stability | Drift3~5%/Year | Zero Drift | Drift<1%/Year |
| Resistance to Electromagnetic Interference | Poor | Excellent | Excellent |
| Per-Point Cost | 20~50CNY | 800~1500CNY | 200~500CNY |
| Service Life | 3~5Year | 10~15Year | 5~8Year |
| Installation Method | Adhesive Bonding+Waterproof | Adhesive Bonding/Welding | Welding/Bolt Fixing |
| Recommended Location | Secondary Measurement Point | Critical Section | Long-term Detection Acquisition Edge Node |
2.2 Vibration Monitoring
Acceleration sensors capture the dynamic response of the overhead crane during operation—hoisting impacts, crane bridge start/stop, and load sway all induce structural vibration. Combined with an edge computing and OPC UA data acquisition solution, vibration signals reveal changes in structural stiffness: when a weld seam cracks or a bolt loosens, the structure's natural frequency drops by 0.5–3%, a shift that the online monitoring system can detect in real time.
Accelerometer selection guidelines: measuring range ±5g (crane operating vibration typically stays below 2g), frequency response 0.5–200Hz (the first-order natural frequency of crane steel structures generally falls between 1–10Hz), and sensitivity ≥100mV/g. Recommended mounting locations: mid-span of the main girder (vertical + transverse axes), mid-section of the end carriage (transverse axis), and trolley rail joints (vertical axis).
2.3 Displacement and Deformation Monitoring
The deflection of the crane main girder under full load is the core indicator of structural stiffness. A laser displacement sensor (accuracy ±0.5mm, measuring range 0–200mm) is mounted at the end of the crane rail, working with a reflective target at mid-span to measure the main girder deflection curve in real time. If the full-load deflection increases by more than 15% over the baseline value, it is a strong indication that structural stiffness has degraded and a detailed inspection should be scheduled.
| Detection Parameter | Sensor Type | Installation Location | Accuracy Requirement | Sampling Frequency |
|---|---|---|---|---|
| Stress-Strain | FBG/Resistance Strain Gauge | Main Girder Mid-span, Weld Seam Zone, End Carriage Corner Point | ±1~5με | 100Hz |
| Vibration Response | MEMS/Piezoelectricaccelerometer | Main Girder Mid-span, End Carriage, trolley rail | ±0.01g | 200Hz |
| Structure Deformation | laser displacement sensor | Crane Rail End Main Girder Mid-span Reflector Target | ±0.5mm | 10Hz |
| Temperature Compensation | Thermocouple/Platinum Resistance | Main Girder Inner/Outer Side Comparison | ±0.5°C | 1Hz |
| Crack Detection | acoustic emission(AE)Sensor | Stress Concentration Zone, Detected Defect Recommended Location | ±1dB | 500kHz |
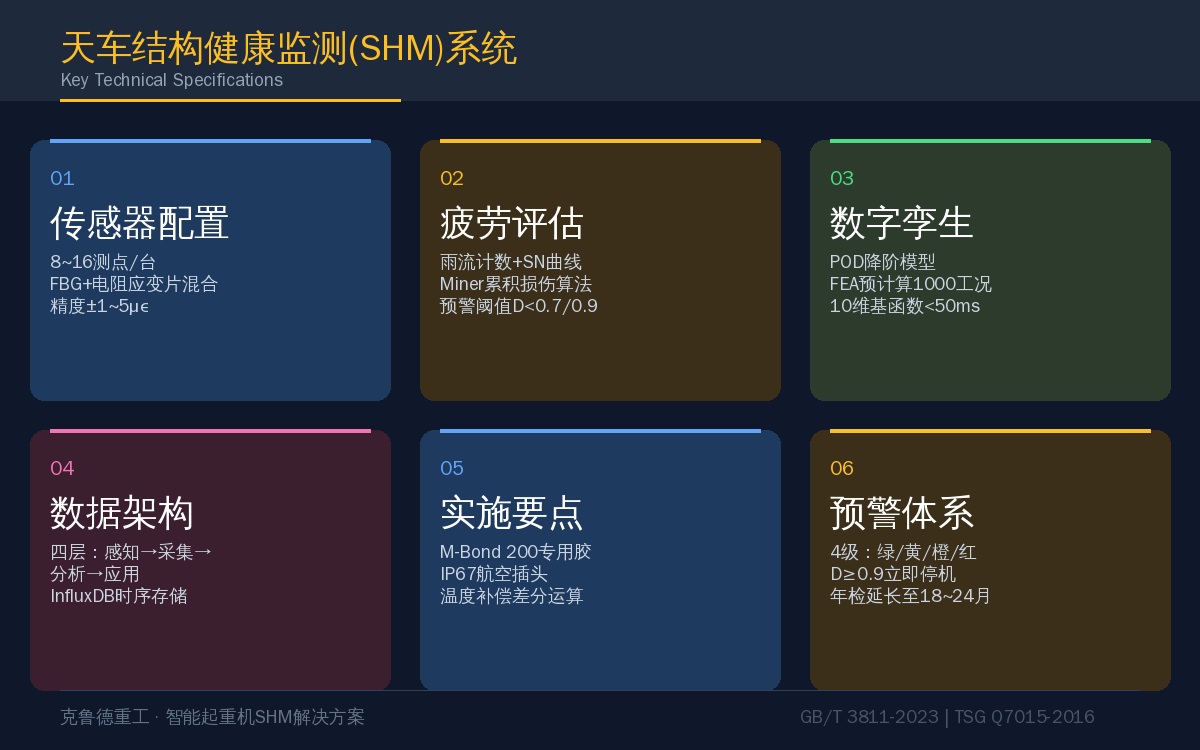
Fatigue Life Assessment Methods for Overhead Cranes
Fatigue life assessment is the core algorithmic engine of the entire SHM system for overhead cranes. Fatigue is not a one-time calculation—it evolves dynamically with every lift and every travel cycle. Our approach follows a three-step methodology:
3.1 Stress-Time History Acquisition
Strain sensors continuously capture strain signals at critical sections of the main girder at a 100 Hz sampling rate, which are then converted to stress using the elastic modulus E = 206 GPa. The key principle here is to never substitute statistical values for time-series data—averages lose the peak-valley information essential for fatigue analysis. Raw time-series data is stored in InfluxDB with a 30-day rolling retention period. Data older than 30 days is compressed into rainflow counting results (matrix format) at a compression ratio of approximately 200:1.
3.2 Rainflow Counting for Cycle Extraction
Rainflow counting is the industry-standard method for fatigue analysis (per ASTM E1049-85), extracting complete stress cycles from the stress-time history. Taking a 32-ton bridge crane as an example, one complete lift-transport-lower operation generates approximately 15 to 30 stress cycles, including one major cycle (from no-load to full-load and back to no-load) and several minor cycles caused by crane bridge start/stop and trolley movement-induced local stress fluctuations.
For implementation, we recommend the Python Rainflow library—it takes just three lines of code:
import rainflow stress = get_stress_timeseries(sensor_id=1, start=ts_start, end=ts_end) cycles = rainflow.count_cycles(stress, ndigits=1) # Return [(range, mean, count), ...]3.3 S-N Curves and Miner's Linear Cumulative Damage Rule
The S-N curve (stress-life curve) defines the fatigue characteristics of the crane steel structure material. For Q355B steel (≈S355JR), the S-N curve parameters reference ISO 4301: m = 3.0, C = 1.2 × 10¹². The basic form is:
N_f = C × σ⁻ᵐ
Where N_f is the fatigue life (number of cycles) at stress amplitude σ, and C and m are material constants. Each stress cycle extracted via rainflow counting is accumulated using Miner's linear cumulative damage theory:
D = Σ(n_i / N_fi) < 1.0
When the cumulative damage D reaches 1.0, the material is theoretically at its fatigue life limit. In engineering practice, a yellow warning is triggered at D = 0.7 and a red alarm at D = 0.9, ensuring an adequate safety margin.
| Early Warning Grade | Cumulative Damage D | Status Description | Recommended Action |
|---|---|---|---|
| Green(Normal) | D < 0.4 | Structural Safety, Per Cycle Inspection | Routine Maintenance |
| Yellow(Attention) | 0.4 ≤ D < 0.7 | Structural damage present but below critical threshold | Shorten Detection Cycle to6Months |
| Orange(Early Warning) | 0.7 ≤ D < 0.9 | Approachingfatigue life, Detailed Inspection Required | Schedule Non-destructive testing+Stress Verification |
| Red(Alarm) | D ≥ 0.9 | Structure in Critical Condition | Immediate Shutdown, Conduct Detailed Structural Assessment |
Digital Twin Integration for Overhead Crane Monitoring
A key advantage of the SHM system is its ability to map sensor data onto a 3D model, creating a true Digital Twin. The overhead crane's 3D model is built to a 1:1 scale, with critical cross-sections meshed using finite element analysis (SHELL181 shell elements at a 20 mm grid size). Measured strain data is applied as boundary conditions to the model, enabling real-time stress field simulation.
The data flow architecture for the Digital Twin SHM system is outlined below:
| Module | Input | Data Processing | Output |
|---|---|---|---|
| Sensor Data Aggregation | Stress-Strain/Vibration/Raw Displacement Signal | Signal Filtering+Outlier Removal+Resampling | Standard No.rmalized Time-Series Data |
| Finite Element Surrogate Model | Measured Boundary Conditions+Load spectrum | ROMReduced-Order Model Fast Computation | Full-Structure Stress Field Heat Map |
| Fatigue Damage Engine | Rainflow Counting Result+S-NCurve | Miner Cumulative Damage Calculation | Each Sectionremaining life Prediction |
| Condition Assessment Dashboard | Stress Field+Fatigue+Vibration Eigenvalue | Multi-Dimensional Fusion Evaluation | Health Score+Maintenance Recommendation |
Key Implementation Details: The Digital Twin model doesn't run FEA directly—each FEA solve takes 20–30 minutes, making real-time execution impossible. Instead, we use a reduced-order model (Proper Orthogonal Decomposition, POD) with 1,000 pre-computed FEA results covering typical operating conditions, building a 10-dimensional basis function space. Online, interpolation within this 10D space delivers results in under 50ms per calculation, with precision loss controlled within 5%.
5. Engineering Implementation Lessons
Installing an SHM system isn't like mounting a surveillance camera—you can't just plug it in and walk away. Here are the pitfalls we've encountered in real projects:
1. Strain Gauge Adhesive Matters — Standard cyanoacrylate (super glue) becomes brittle within two months in overhead crane environments ranging from -20°C to 60°C. We recommend M-Bond 200 series cyanoacrylate adhesive with catalyst—cures in 24 hours and operates from -50°C to 100°C. Before bonding, grind the substrate to Ra3.2 roughness and degrease three times with acetone.
2. Don't Skimp on Waterproofing — Crane workshops are dusty, oily, and subject to washdowns. After bonding, apply a layer of HBM SG250 neutral silicone, then wrap with aluminum foil tape and heat-shrink tubing for mechanical protection. Use IP67 aviation connectors at flange joints—terminal blocks oxidize and lose contact within two months.
3. Wireless vs. Wired: How to Choose — We tested LoRa wireless strain nodes; batteries needed replacement every six months and dropout rates ran around 3%. Our recommended approach: fixed measurement points (main girder, end carriages) use wired connections (shielded twisted pair + RS485/Modbus), while moving components (trolley frame) go wireless. A hybrid network offers the best reliability and lowest long-term maintenance.
4. Never Overlook Temperature Compensation — Temperature swings between winter and summer can exceed 40°C in crane service. Thermal strain in the steel structure can reach 300–400 με, which completely masks load-induced strain (typically 200–300 με at full load). Every strain measurement channel must include a temperature compensation gauge mounted on an unstressed test block of the same material. Data processing uses differential calculation: ε_actual = ε_measured - ε_compensation.
5. Higher Sampling Rates Aren't Always Better — 100 Hz is sufficient for strain monitoring to capture the dynamic response of crane hoisting (first natural frequency below 5 Hz), and 200 Hz covers vibration monitoring. Higher sampling rates only create storage and transmission bottlenecks. The only exception is acoustic emission (AE) testing—which requires 500 kHz sampling—but that's a dedicated crack detection method, not part of routine SHM.
Conclusion
Structural health monitoring for overhead cranes boils down to three things: install the right sensors, calculate fatigue accurately, and alert promptly. The underlying technology isn't new—bridges and wind turbines have used it for over a decade—but crane industry standards are still evolving, and most manufacturers are waiting on the sidelines. Kelude has equipped multiple overhead cranes with SHM systems over the past two years. The most common user feedback? "We no longer hold our breath waiting for the annual inspection."
Next, we'll integrate SHM data with our existing remote monitoring platform, giving users a single dashboard for both operational parameters and structural health status. The system also supports retrofitting on existing cranes without modifying the original electrical system.
Further reading: AI Visual Weld Inspection for Overhead Cranes—while SHM monitors steel structure safety during service life, AI visual weld inspection screens out welding defects at the manufacturing stage. Together, these two lines of defense ensure main girder structural integrity from factory floor to end of service life.
Frequently Asked Questions
Q: What hardware investment does an overhead crane SHM system require?
A: A complete SHM system includes strain sensors (8–16 measurement points), a dynamic data acquisition unit, an edge computing industrial PC, and communication modules. For a 30-ton bridge crane, hardware costs run approximately $12,000–$15,000 per unit, with total investment including installation and commissioning around $18,000–$22,000 per unit. If you only monitor critical cross-sections (4–6 measurement points), costs can be kept under $7,500.
Q: Can SHM systems be retrofitted on older cranes?
A: Absolutely. The SHM system operates as an independent monitoring layer—it doesn't alter the crane's existing electrical system or control logic, and no re-certification (Type Test) is required. Sensors are bonded or welded to the steel structure surface, cabling runs along existing crane cable trays, and installation doesn't interrupt normal production. Typical installation takes 3–5 days, scheduled during planned downtime. For cranes in service over 10 years, fatigue accumulation in the steel structure is already significant—real-time monitoring provides peace of mind.
Q: Can installing an SHM system extend the periodic inspection interval?
A: Yes. Under ISO 4301 Crane Design Standard and TSG Q7015-2016 (Rules for Periodic Inspection of Lifting Appliances), if continuous online stress monitoring is in place and structural safety assessment reports are issued regularly, the inspection body may extend the periodic inspection interval from 12 months to 18–24 months. The final decision rests with the local special equipment inspection institute, based on data completeness and system reliability. Extending the inspection interval isn't about saving money—it means structural condition is continuously monitored rather than checked once a year.
